Hi, I'm Kevin
Data is the foundation. AI is the lens.
Data & AI Builder · Connecticut

About
I'm a data analyst turned AI-native builder based in Connecticut. My career started in business intelligence and analytics: Tableau, SQL, the craft of making complex data legible to busy humans.
But the field evolved, and so did I. Today I work at the intersection of data foundations, AI tooling, and information experience design. I build full-stack applications with LLM integration, design data architectures that make AI systems smarter, and still obsess over the same question I started with: how does information become understanding?
I believe AI is the most powerful analytical tool we've ever had, and that it only works when humans stay in the center of the design. The data has to be structured with intention. The interface has to respect the person using it. The intelligence has to augment judgment, not replace it.
Every tool I build asks the same question: how do people experience information, and how does that shape what they feel, think, and do?
Philosophy
Data as foundation
AI doesn't work without well-structured data. I build the foundations that make intelligent systems possible: clean pipelines, clear schemas, and thoughtful architecture.
AI as a tool, not a replacement
The best AI doesn't remove humans from the loop. It gives them sharper instincts, faster answers, and more time for the work that requires judgment.
Design for the human
Every dashboard, app, and system I build starts with the same question: what does the person on the other side need to feel, know, and do next?
Work Experience

Evolved from building dashboards to designing the data foundations that power AI tools. Building full-stack applications with LLM integration, MCP architecture, and conversational interfaces — while still grounding everything in clean data and human-centered design.
As an Insights Analyst at Meta, I partner across the People organization to deliver actionable analytics that inform strategy and elevate the employee experience. My work spans Tableau and Salesforce dashboard development, service operations analysis, and product journey analytics - all focused on democratizing data access and surfacing friction points that matter. I also collaborate with Data Science and Engineering on GenAI/ML solutions for HR workflows, and design the KPIs that track organizational health and operational efficiency.

As a Senior Data & Analytics consultant, I specialized in visual analytics, bringing a human-centered design thinking approach to designing and developing intuitive dashboard experiences primarily in Tableau and Power BI. I gained experience in both leading and contributing to user-centric analytics solutions across Healthcare, Insurance, Financial Services, and Technology clients.
Skills
Tools
Check out my latest work
Dashboards, data stories and AI-native tools — each an attempt at the same question: how does information become understanding?
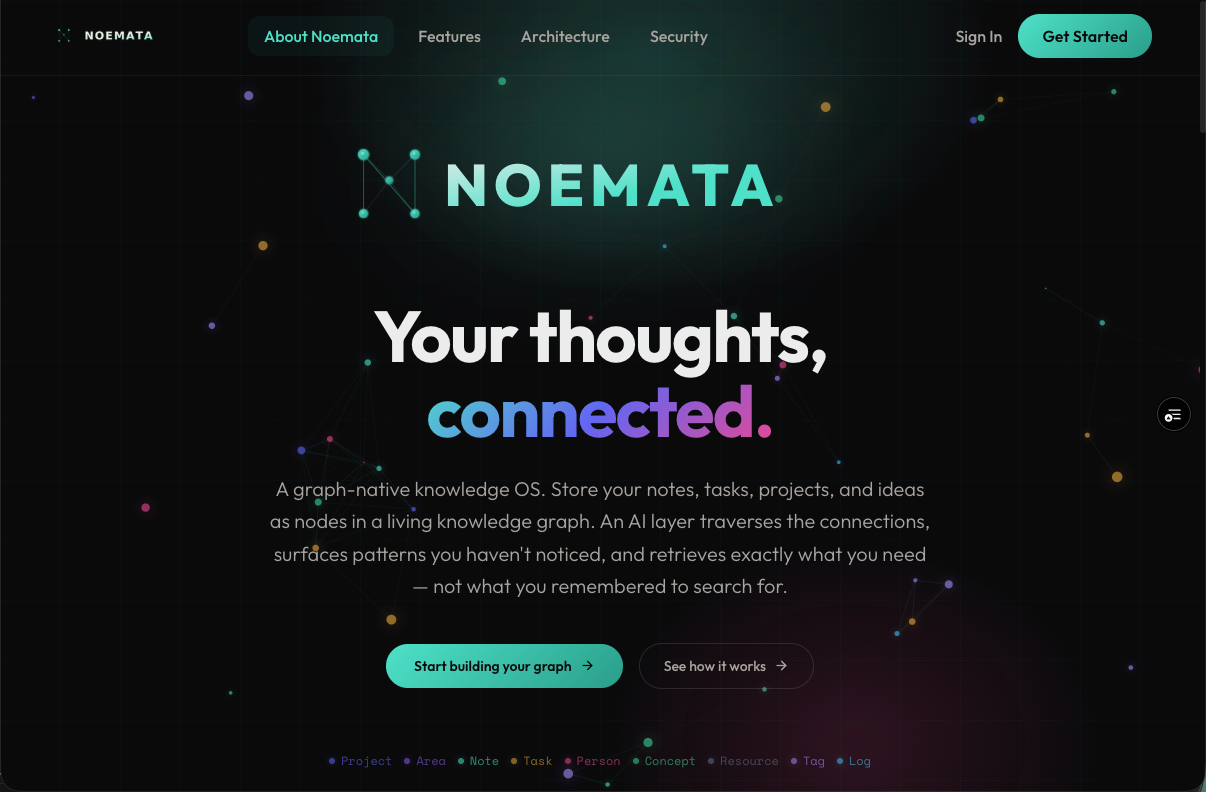
A full-stack application integrating LLM intelligence with a structured GraphRAG data backbone. Everything in Noemata is a node. Notes, tasks, projects, people, concepts: all connected in a living knowledge graph that an AI layer traverses, links, and makes sense of for you.
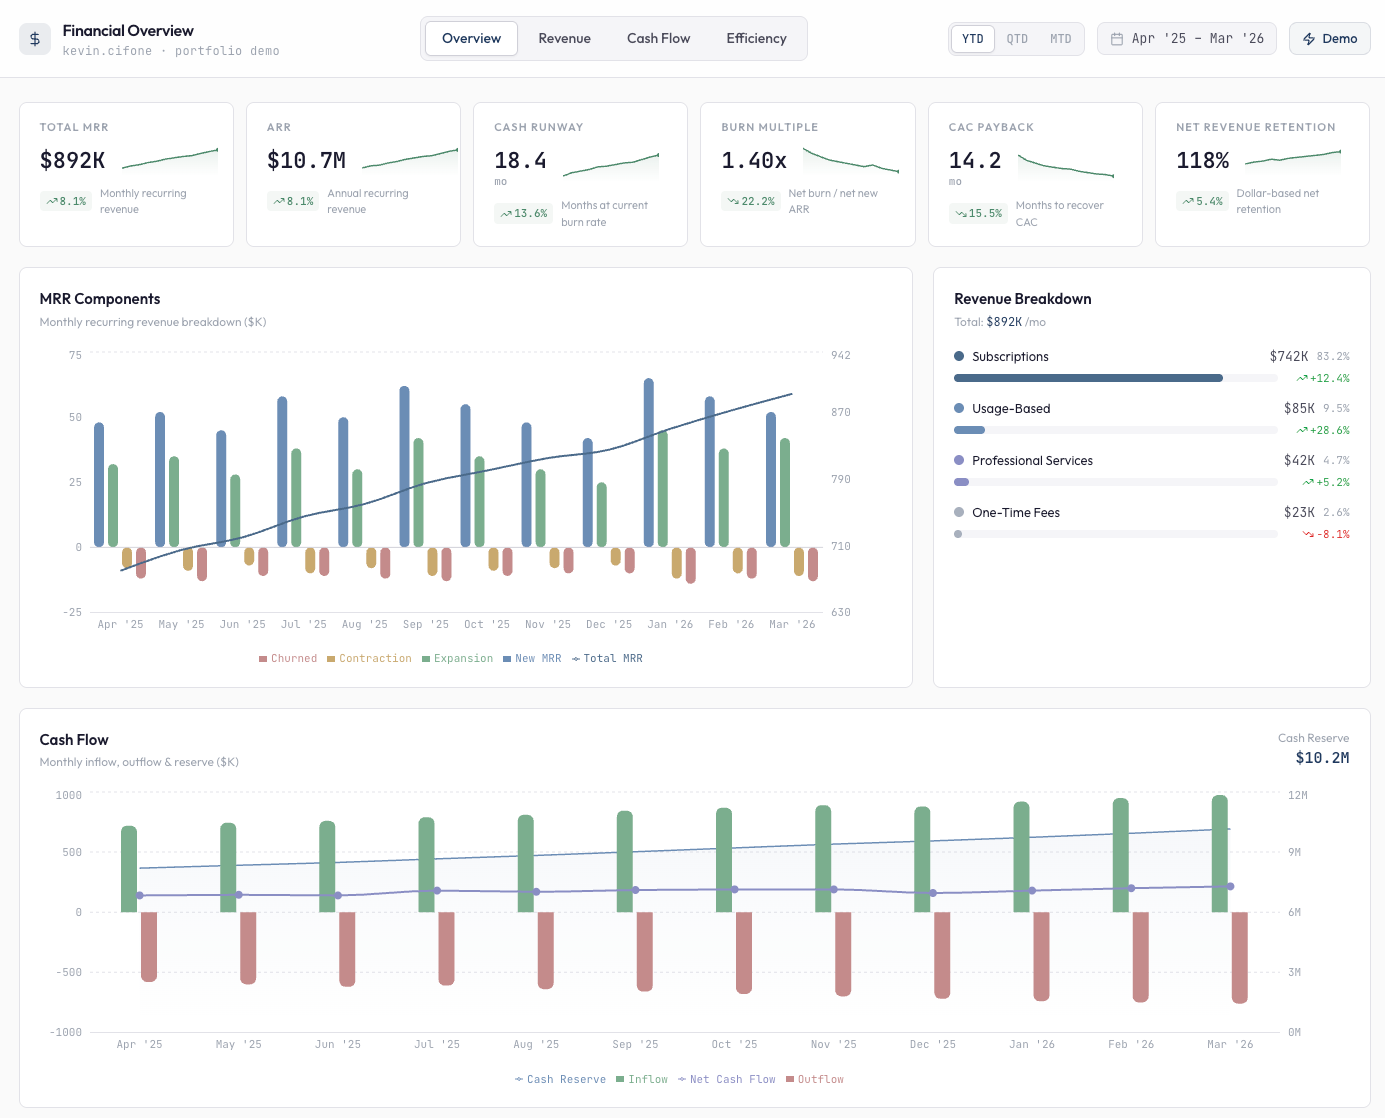
An interactive financial dashboard for a fictional Series B SaaS company (~$10M ARR). Features six animated KPI cards, MRR component breakdowns with dual-axis charting, cash flow visualization, a P&L variance heatmap, unit economics bullet charts, and AI-powered insights. Built with Next.js 16, TypeScript, Recharts, D3.js, and Tailwind CSS.
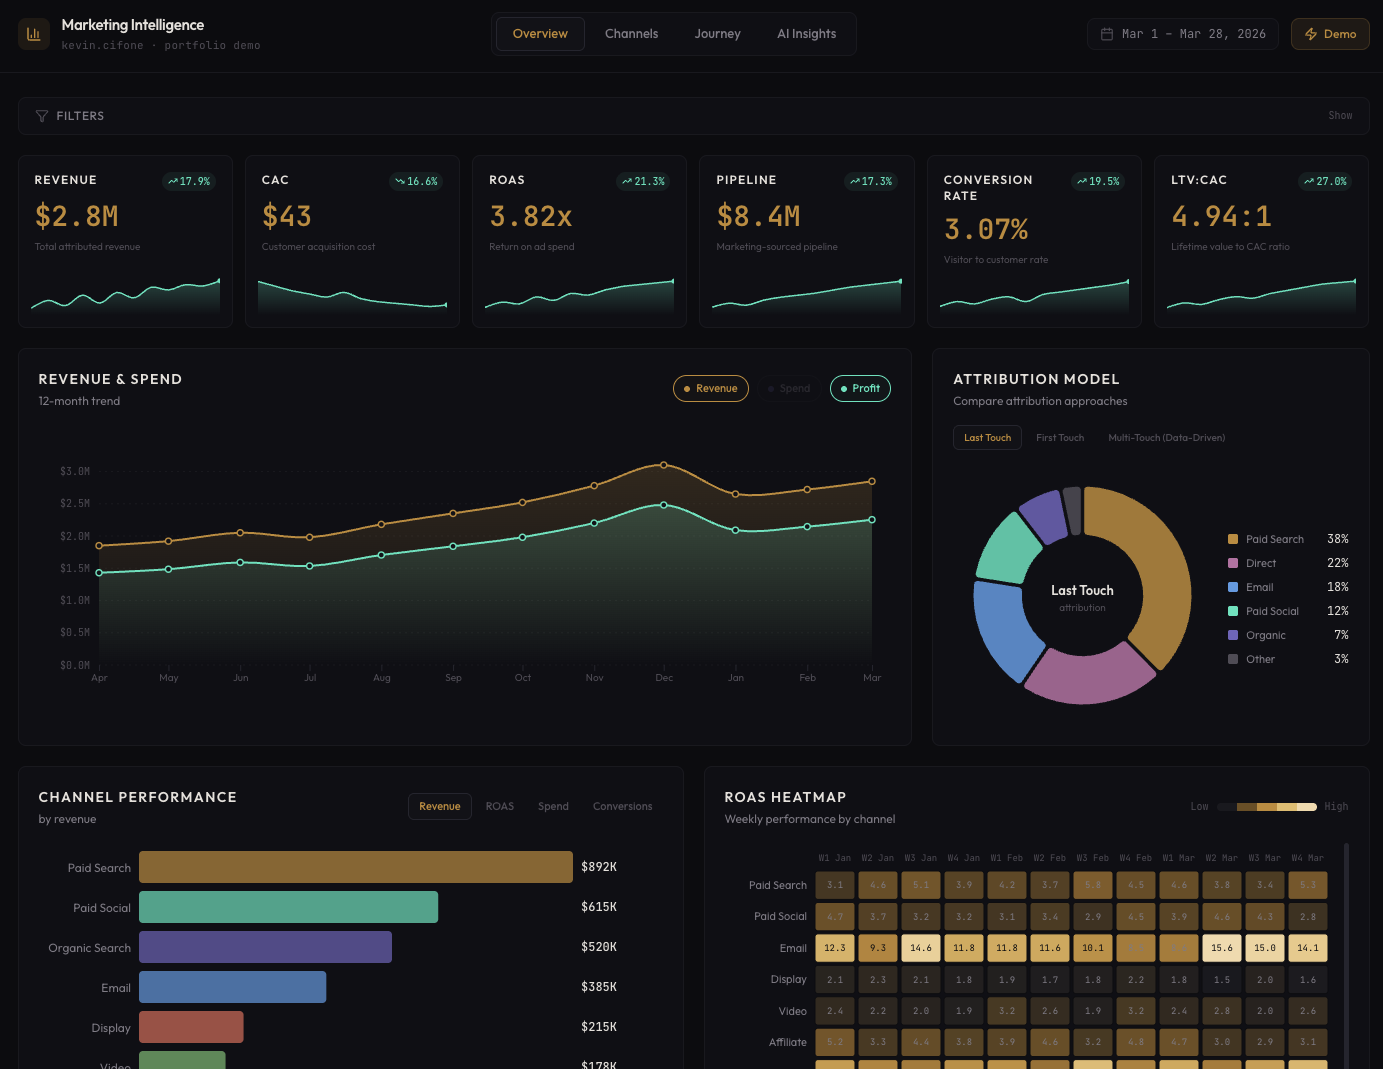
An omnichannel marketing analytics dashboard built from scratch with Next.js, D3.js, and Tailwind CSS. Six custom D3 visualizations (area charts, Sankey flows, heatmaps, donut charts) render realistic mock data across revenue, channel performance, multi-touch attribution, and audience segmentation. An AI-powered insights panel surfaces anomalies, trends, and opportunities with impact scoring and expandable detail cards.

An end-to-end talent acquisition and onboarding analytics suite built on mock data. Five interconnected dashboards follow the full hiring lifecycle from sourcing channel ROI through pipeline conversion, req fulfillment, and new hire experience. Designed for an executive-level audience. Built in Tableau with a custom dark-theme design system, branded navigation, and a narrative structure that moves from strategic KPIs to diagnostic detail.
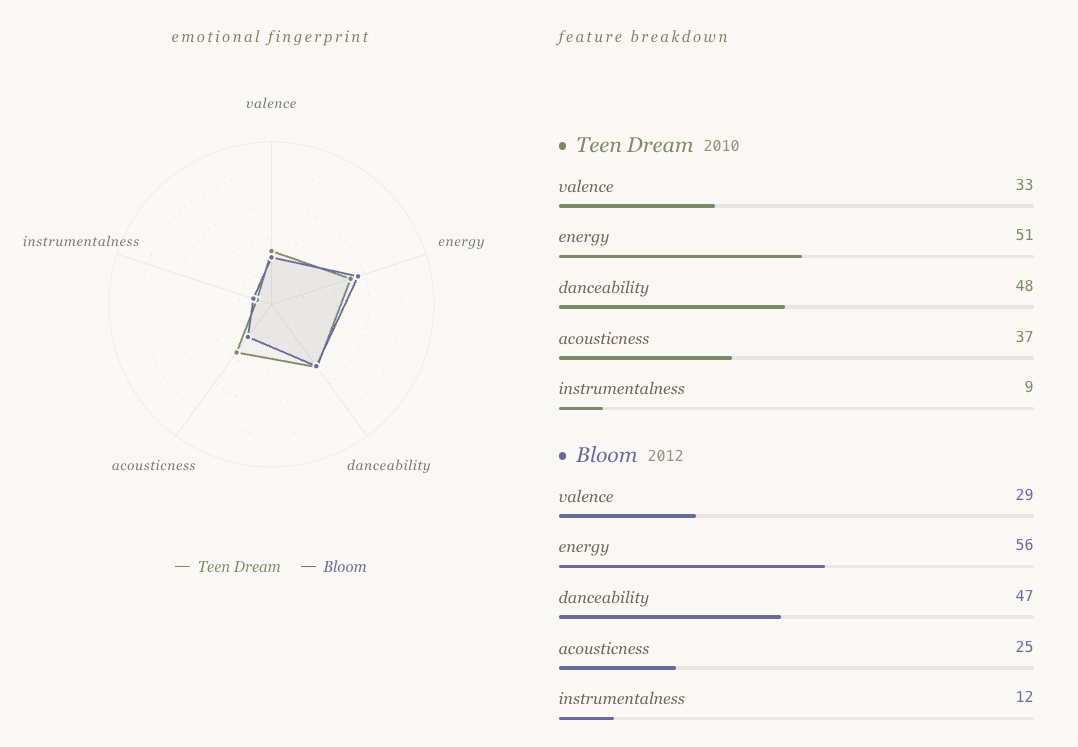
Built as a passion project, Sound & Feeling maps audio features (valence, energy, danceability, acousticness, instrumentalness) across Beach House's complete studio discography (2006–2022) to reveal the emotional architecture of their music. Audio features are sourced from Spotify's audio analysis methodology.
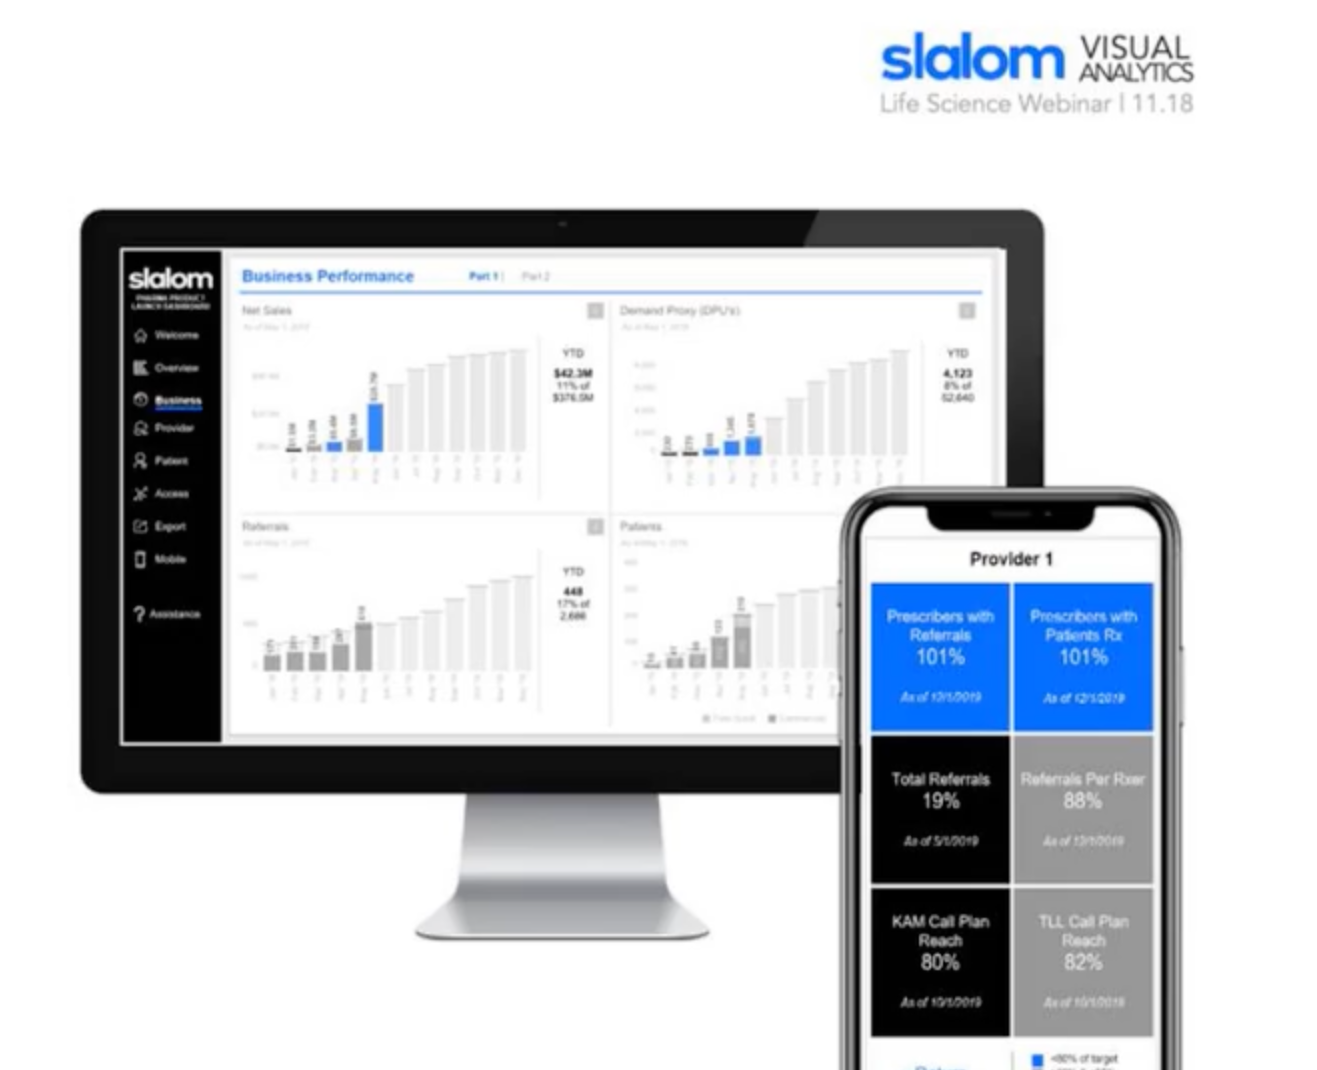
Presented alongside Slalom consulting colleagues in a webinar on how visual analytics power pharmaceutical launch strategy. Our team designed a suite of Tableau dashboards that enabled cross-functional teams to track and act on critical data during the high-stakes post-FDA-approval window, turning complex launch metrics into clear, actionable reporting. The session covered best practices in combining data, design, and strategy to build analytics solutions for life sciences organizations.